*Basic
The S curve is a chart that is used to visualize and predict the performance of a project over time.[1] By comparing the expected shape of the S curve against its current shape, project managers can track the progress of a project.[2]
**Intermediate
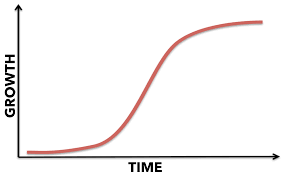
The reason it's called the s curve is because the shape of the graph forms a shallow “Sâ€.[3] The growth of the curve begins slow, just like a project. As more progress is made, the growth accelerates rapidly creating an upward slope. Then the growth begins to plateau, forming the upper part of the “sâ€, which is the project at maturity.[4] A sample s curve is shown below:[5]
***Advanced
Comparison of the Target S-curve and the Actual S-curve reveals the progress of the project over time.[6] The Actual S-curve will typically sit below the Target S-curve for most of the project due to a number of factors such as delays in updating the project schedule. But as the project ends both curves will come together.[7]
Sources
[1] Editors (2021) How S-curves can help you track project progress. Monday Blog. Monday.com
[2] [6] Editors (2019) Everything you need to know about S-Curve in project management. Task. Ntaskmanager.com
[3] Editors. What is the S-Curve in project management? Wrike. Wrike.com
[4] Taylor, D. P (2020) What is an S-Curve in project management? The blueprint. Fool.com
[5] Dunford, N (2018) The S-curve: How businesses actually grow. Ittybiz. Ittybiz.com
[7] Editors (2021) How to use S-Curves for Monitoring and Reporting Project Progress. Schedule Reader. Schedulereader.com